If you compare insect protein with whey, pea or a precision-fermented protein on the label figure, you may be paying about 1.5 times as much per gram of amino acids as your spreadsheet says. EFSA's opinion on frozen locust paste, published in October, gives enough data to show why, and to correct for it.
At a glance
- 13.8 to 14.8 g protein per 100 g of locust paste on the legal basis, total nitrogen x 6.25 (EFSA)
- 9.24 to 9.86 g per 100 g when EFSA applies a conversion factor of 4.18 instead (EFSA)
- 9.49 g per 100 g, the mean of the amino acid residues measured in five batches (FoodEdge calculation from EFSA's amino acid table)
- 1.5x the cost per kilogram of amino acid protein, against cost per kilogram of labelled protein (FoodEdge calculation)
- About a quarter of the gap can be traced to chitin, on our estimate and in an earlier ETH Zurich study
Sources: EFSA NDA Panel, EFSA Journal 2026;24(10):e10317; Boulos, Tännler and Nyström, Frontiers in Nutrition 2020; FoodEdge calculation.
What EFSA assessed
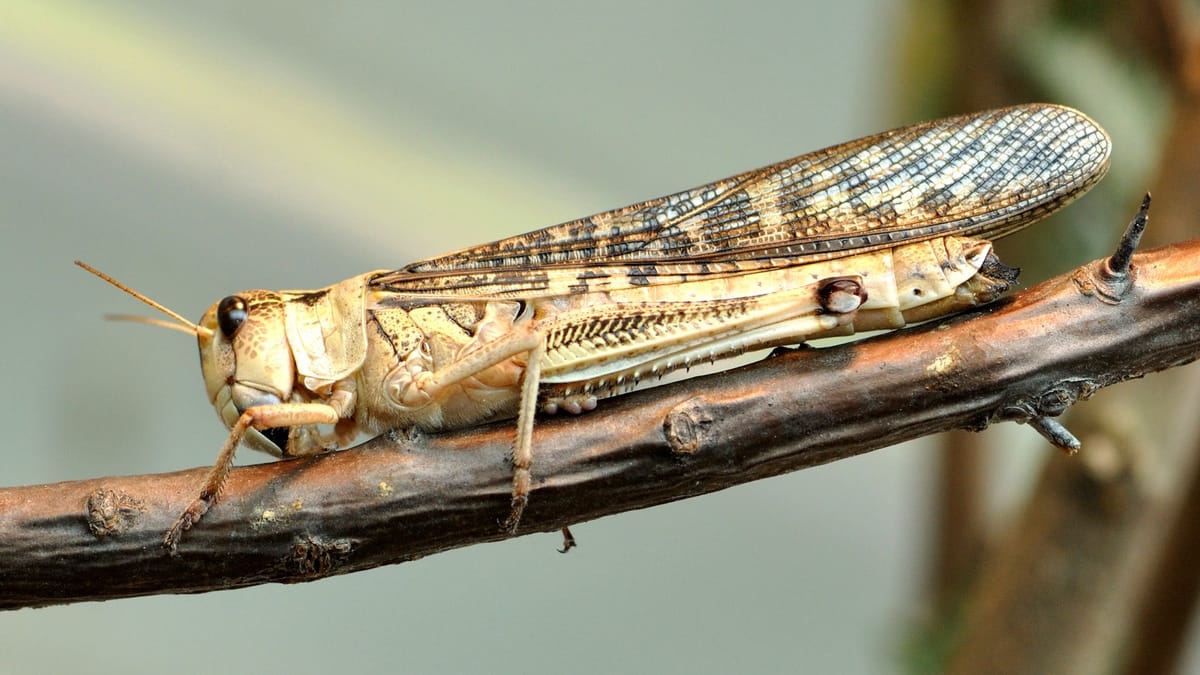
On 5 October 2026 the EFSA Panel on Nutrition, Novel Foods and Food Allergens published its opinion on a frozen paste made from blanched, whole migratory locusts (Locusta migratoria), farmed and harvested as sub-adults. The applicant, the Belgian Insect Industry Federation, filed the request in May 2018. The Panel concluded that the paste is safe under the proposed uses and use levels, and noted that it may trigger allergic reactions, including in people allergic to crustaceans, mites and molluscs.
The proposed uses run from 10 to 40 g of paste per 100 g of food: crackers, pasta, biscuits, sausages, ready dishes, breakfast cereals, spreads, chocolate products and crisps. This is a safety opinion. Authorisation is a separate decision by the European Commission; the Commission has not yet authorised the paste.
The safety conclusion is the headline. The protein section is where the useful detail for R&D and investment teams sits.
The legal number and the true number
The paste is mostly water: 73.3 to 78.0 g per 100 g across five batches. Crude protein, measured by Kjeldahl nitrogen and multiplied by 6.25, came to 13.81 to 14.75 g per 100 g, or 14.20 g on average.
The Panel then says plainly that this "overestimates the true protein content" of the paste, because of non-protein nitrogen, mainly from chitin, the polymer in the insect's exoskeleton. Using a factor of 4.18, EFSA puts true protein at 9.24% to 9.86%. It also notes that, for nutrition labelling under Regulation (EU) No 1169/2011, protein is defined as total Kjeldahl nitrogen multiplied by 6.25.
So the label figure is the legal figure, and EFSA's own text says it overstates the protein.
We reran the calculation from EFSA's own tables
The opinion publishes the full amino acid profile for each of the five batches (Table A1). That lets anyone check the 4.18.
The sum of the amino acids in EFSA's table is 10.4 to 11.5 g per 100 g. That sum is the weight of free amino acids. Protein is made of amino acid residues: each peptide bond releases a molecule of water, so the protein itself weighs less than its hydrolysed amino acids. Taking that water out, the residues come to 8.94 to 9.83 g per 100 g, with a mean of 9.49 g.
Divide the residues by total nitrogen and you get the factor this paste actually supports: 3.99 to 4.32 by batch, 4.18 on average. EFSA's 4.18 matches the applicant's own data.
There is one loose end. EFSA attributes the 4.18 to the literature, citing Boulos and colleagues at ETH Zurich (2020). We read that paper and its supplementary data and could not find 4.18 in either. Boulos et al. report a factor of 5.33 for adult locusts sold in Switzerland, and the same 5.33 as their average across mealworms, crickets and locusts. Our reading is that the number is sound for this paste and the citation does not show where it came from. We note it here so that anyone who cites the factor checks where it came from.
The choice matters. Apply Boulos's 5.33 to this paste and you get about 12.1 g of protein per 100 g. Apply the factor the amino acids support and you get 9.5 g. Picking a factor from the literature, rather than from the batch in front of you, moves the answer by more than 2.5 g per 100 g.
Same nitrogen, three protein figures
How much of the gap is chitin?
EFSA's wording points to chitin. The applicant measured it at 2.3 to 3.0 g per 100 g, 2.8 g on average, using an acid detergent fibre method. The Panel notes there is no recognised reference method for chitin in insects.
Chitin is built from N-acetylglucosamine, which is about 6.9% nitrogen by weight. On that basis, the chitin in this paste carries enough nitrogen to account for about 1.2 g of the "protein" on the label. The total gap between label and amino acid residues is 4.7 g. Chitin explains roughly a quarter of it.
That matches Boulos et al., who found chitin responsible for about a quarter of the gap between their measured factors and 6.25, and found that subtracting chitin nitrogen alone still left protein overstated by about 13%. The remainder comes from other non-protein nitrogen and from the fact that 6.25 assumes protein is 16% nitrogen. Insect protein in the Boulos study carries more nitrogen than that.
The practical consequence: a supplier who "corrects for chitin" has fixed about a quarter of the problem.
What it changes in a formulation and a cost model
Take a cracker at the applicant's proposed maximum of 20 g of paste per 100 g. On the label basis the paste contributes 2.84 g of protein per 100 g of cracker. On the amino acid basis it contributes 1.90 g. In a dish other than pasta, rice, sandwiches or pizza, at 40 g, the figures are 5.68 g and 3.80 g. Whether the finished product reaches "source of protein" (at least 12% of energy from protein) or "high protein" (at least 20%) depends on the whole recipe, and legally the claim is calculated on the 6.25 basis.
The exposure sits in the comparisons a team makes outside the label:
- Cost. If you buy on price per kilogram of labelled protein, your cost per kilogram of amino acid protein is about 1.5 times higher (14.20 divided by 9.49).
- Replacement ratios. Swapping a dairy or plant protein for insect protein gram for gram on the label will under-deliver amino acids.
- Protein quality. The applicant's in vitro digestibility result, 85.4%, is based on soluble nitrogen. EFSA notes that this cannot be used for PDCAAS or DIAAS scores.
- Pitch decks and investment cases. A "protein per hectare" or "protein per euro" comparison built on 6.25 flatters insects against sources whose factor sits closer to 6.25.
Finding / Limit / Decision
Finding. In EFSA's own data, the locust paste's labelled protein (14.20 g per 100 g on average) is about 1.5 times its amino acid protein (9.49 g). EFSA's corrected range, 9.24 to 9.86 g, is consistent with that. Chitin accounts for about a quarter of the difference.
Limit. This is one product, five batches and one applicant. Amino acid analysis after acid hydrolysis can lose some amino acids, so the residue figure may be slightly low, and the chitin method has no reference standard. Our residue calculation and the chitin estimate are FoodEdge calculations from published tables, not EFSA findings. EFSA's 4.18 is cited to a paper that reports 5.33 for locusts.
Decision. Keep 6.25 on the label, because the law requires it. Use the amino acid basis for everything else: supplier comparisons, cost per kilogram of protein, replacement ratios and any protein quality statement. Before you sign for an insect protein ingredient, ask for total nitrogen and a full amino acid profile for each batch, and calculate the factor yourself.
Ask at your next review
Which conversion factor sits behind the protein figure in this supplier's specification, and was it measured on these batches or borrowed from the literature?
Your next step
If an insect, fungal or fermented protein sits in a deal or a portfolio you are reviewing, these are the questions FoodEdge technical due diligence works through, with the sources named and the uncertainty stated.
See how FoodEdge technical due diligence works
Proof before hype.
Sources
- EFSA NDA Panel (2026). Safety of frozen paste from blanched, whole migratory locust (Locusta migratoria) as a novel food pursuant to Regulation (EU) 2015/2283. EFSA Journal 24(10):e10317. doi:10.2903/j.efsa.2026.10317. Adopted 31 August 2026. Tables 1, 2, 10 and A1; sections 3.4.1 and 3.9.1. Read in full on PMC (PMC13635975).
- Boulos S., Tännler A., Nyström L. (2020). Nitrogen-to-protein conversion factors for edible insects on the Swiss market: T. molitor, A. domesticus and L. migratoria. Frontiers in Nutrition 7:89. doi:10.3389/fnut.2020.00089.
- Regulation (EC) No 1924/2006, annex: "source of protein" and "high protein" thresholds, as summarised by the European Commission nutrition claims page, checked 27 Oct 2026.
- FoodEdge calculation (calc.py, 9 Nov 2026): amino acid residues as anhydrous masses from EFSA Table A1; factor = residues divided by total nitrogen (crude protein / 6.25); chitin nitrogen assumes fully acetylated N-acetylglucosamine (14.007 / 203.19 = 6.9% N).
Residue mass for each amino acid = measured mass x (molecular weight minus 18.015) / molecular weight. Asparagine and glutamine are reported as aspartic and glutamic acid after hydrolysis, which introduces a small error in either direction. We did not use EFSA's statement that non-protein nitrogen is "2.21 to 2.36 g/100 g": those values equal the total nitrogen of the five batches, so we treat the phrase as a drafting slip in the opinion.